Marketing Consolidation Success Metrics: Prove ROI Fast

The KPIs that prove a marketing consolidation worked are marketing-originated revenue, blended cost per lead (CPL) and customer acquisition cost (CAC), marketing efficiency ratio (MER), active user adoption rate, data quality score, sync error rate, MQL-to-SQL conversion rate, and brand health signals like share of voice and branded search volume. Consolidation success means achieving measurable revenue synergies and sustainable cost efficiency while restoring or improving funnel velocity and securing team adoption of the unified system.
Here is how those KPIs map to their categories:
- Financial: Marketing-originated revenue, MER, total marketing run rate reduction (TMRR), and annualized cost savings
- Funnel/pipeline: Blended CAC/CPL, MQL-to-SQL conversion rate, sales win rate, and pipeline velocity
- Brand: Share of voice, branded search volume lift, and aided/unaided awareness
- Operational/data health: Active user adoption rate, feature utilization, data quality score, and sync error rate
Table of Contents
- Which metrics should you track after consolidation?
- How should you measure: attribution, data sources, and dashboards?
- What are the most common pitfalls when evaluating consolidation?
- A KPI framework and dashboard playbook you can copy
- What does the evidence say about measured consolidation outcomes?
- Key Takeaways
- The measurement gap nobody talks about
- Omnivancemedia measures consolidation results so you do not have to guess
- Useful sources and further reading
Which metrics should you track after consolidation?
Every metric you track post-consolidation should answer one question: did this change make the business better, and who is responsible for fixing it if it did not? Vanity metrics — impressions, raw follower counts, page views without conversion context — have no place in a consolidation review. According to the AMA, aligning marketing tactics with specific business goals and assigning clear ownership is what separates measurement that drives decisions from measurement that just fills slides.
Financial metrics
Marketing-originated revenue is the dollar value of closed revenue where marketing touched the opportunity first. Measure it in your CRM by filtering closed-won deals to those with a marketing-sourced first touch. The target direction is up; if consolidation is working, a higher share of revenue should trace back to marketing activity. When this number stagnates or drops, it signals a funnel break or attribution gap, not just a reporting problem.
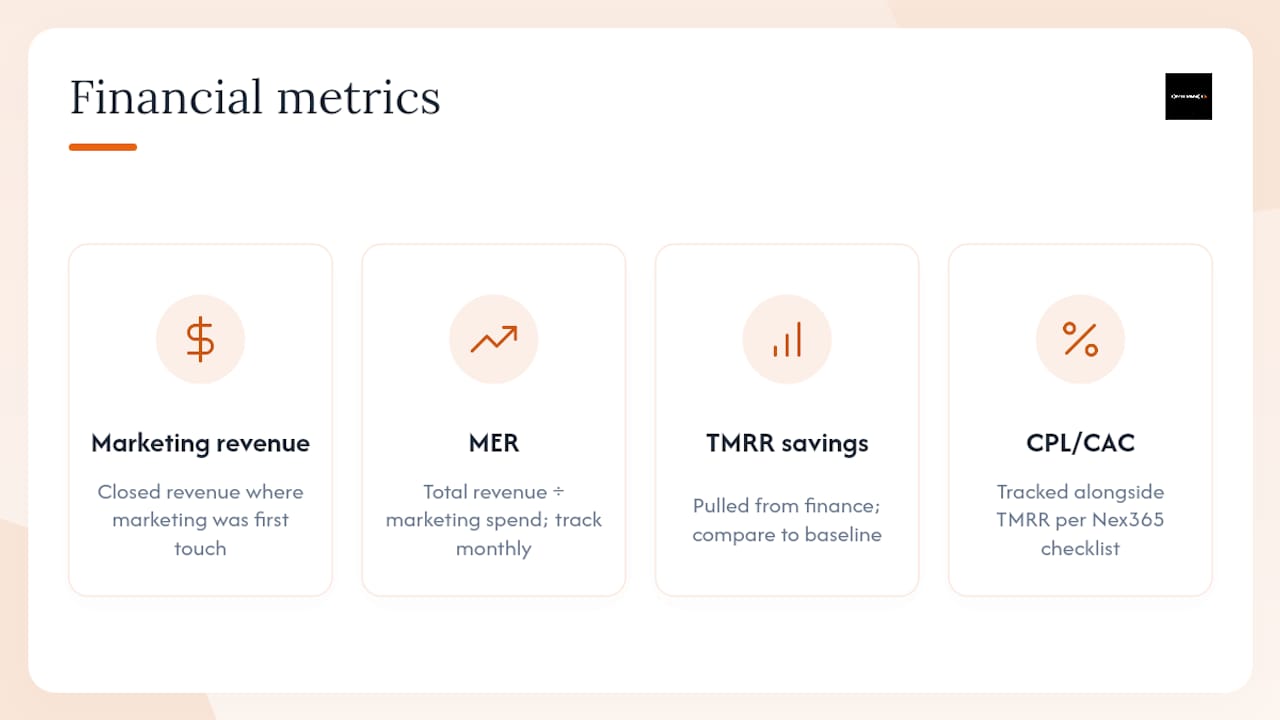
Marketing efficiency ratio (MER) is total revenue divided by total marketing spend. Unlike channel-level ROAS, MER gives you a blended view that survives the attribution noise that consolidation often creates in the short term. Track it monthly. A rising MER after consolidation confirms you are getting more revenue per dollar spent.
TMRR and annualized savings capture the direct cost benefit of eliminating redundant vendors, licenses, and headcount. Pull these from your finance system and compare against the pre-consolidation baseline. Nex365's 12-metric checklist recommends tracking TMRR alongside CPL and CAC as the core financial triad for tool and platform consolidations.
Funnel and pipeline metrics
Blended CAC/CPL normalizes acquisition cost across all channels after you collapse separate channel budgets into one view. Formula: total marketing spend divided by total new customers (CAC) or total qualified leads (CPL). A post-consolidation CPL that rises sharply is a red flag — it usually means a channel was cut that was quietly carrying volume.
MQL-to-SQL conversion rate tells you whether the leads marketing is generating are actually worth the sales team's time. Measure it as SQLs divided by MQLs in a given period. If this rate falls after consolidation, check whether lead definitions changed or whether a high-performing nurture sequence was disrupted.
Pipeline velocity is the speed at which opportunities move through the funnel: (number of opportunities × average deal value × win rate) divided by average sales cycle length. Slower velocity after consolidation often points to a CRM data problem or a broken handoff between marketing and sales.
Customer and retention metrics
Customer lifetime value (CLV) measures the total revenue a customer generates over the relationship. Post-consolidation, CLV should hold or improve as better data and coordinated messaging reduce churn. Track it by cohort — customers acquired before and after consolidation — so you can see whether the new system is actually retaining people better.
Cohort retention rate is the percentage of customers from a given acquisition period who are still active after 30, 60, and 90 days. A drop in early-cohort retention after consolidation often means the onboarding or nurture sequence broke during migration.
Brand health metrics
Share of voice (SOV) measures your brand's presence in the market relative to competitors, typically tracked through tools like Semrush, Brandwatch, or SparkToro. Consolidation sometimes reduces channel presence temporarily, and SOV is the earliest signal that brand visibility is eroding before it shows up in revenue.
Branded search volume is the monthly search volume for your brand name and its variants in Google Search Console or a keyword tracking tool. A sustained lift in branded search after consolidation confirms that integrated messaging is building recognition. A drop is a warning that reduced channel activity is costing you top-of-mind awareness.
Operational and data health metrics
Active user adoption rate is the percentage of your team actively using the consolidated platform or tools within a defined period. Formula: active users divided by licensed users. Low adoption is one of the most common reasons consolidations fail to deliver expected savings — the tools are paid for but not used.
Data quality score and sync error rate measure whether your unified data model is actually working. Track the percentage of records with complete required fields (data quality score) and the number of failed or mismatched syncs between systems (sync error rate). Both should be measured daily in the first 30 days after go-live.
Recommended measurement windows by KPI type
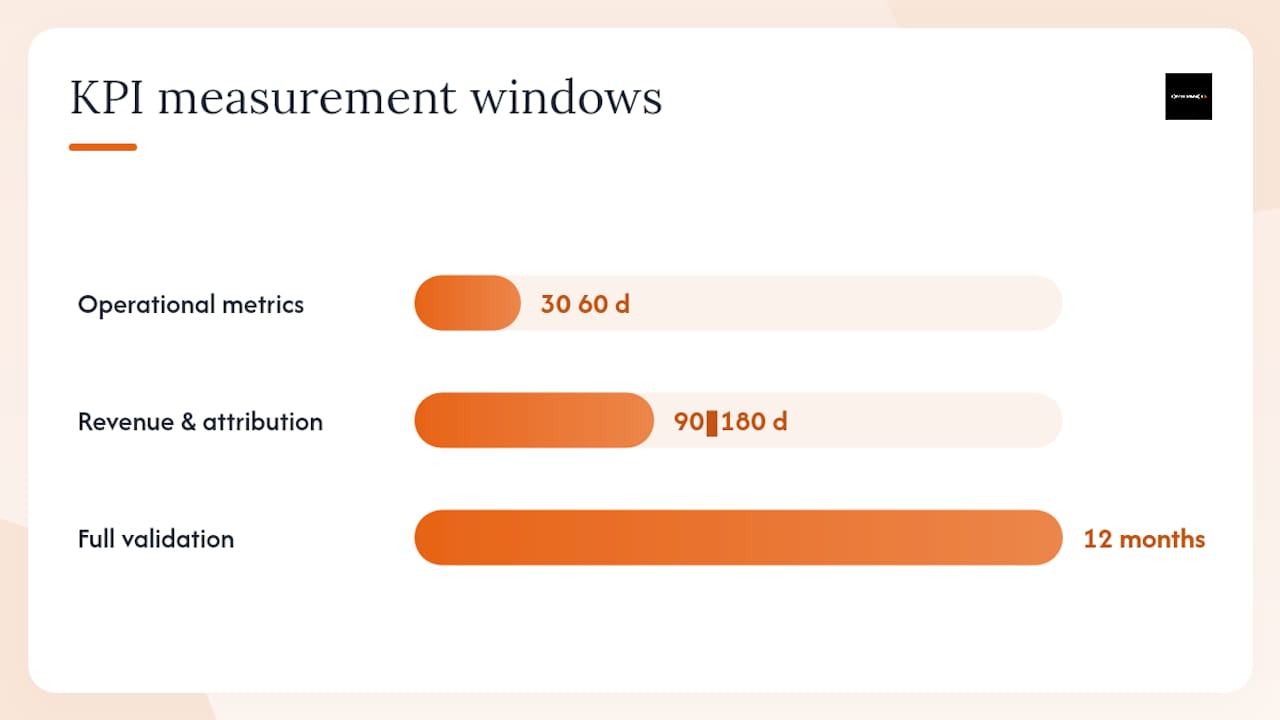
Operational metrics like sync error rate, active user adoption, and data quality score should be reviewed within 30–90 days. These move fast and signal early whether the migration succeeded technically.
Funnel and pipeline metrics — CAC, CPL, MQL-to-SQL conversion, and pipeline velocity — need 30–90 days for early reads and 90–180 days for statistically meaningful conclusions. Funnel metrics are sensitive to deal cycle length; a 30-day read on a 60-day average sales cycle is noise.
Revenue and attribution metrics, including marketing-originated revenue, MER, and CLV, require 90–180 days for initial validation and 12 months for full confidence. Revenue synergies from consolidation often take two to three quarters to materialize as pipeline built under the new system closes.
Setting targets: use percentage improvement over baseline for metrics where you have a stable historical trend (e.g., "reduce blended CAC by 15% within 180 days"). Use absolute thresholds for data health metrics (e.g., "sync error rate below 2% within 30 days"). Avoid setting targets before you have at least 60 days of clean baseline data — targets set on incomplete data become political rather than analytical.
How should you measure: attribution, data sources, and dashboards?
Attribution models for post-consolidation measurement
Last-click attribution is the wrong tool for a post-consolidation environment. It systematically undervalues upper-funnel channels that were often the ones consolidated, which creates a misleading picture of what is actually driving revenue. Multi-touch attribution — linear, time-decay, or position-based — distributes credit across the full path and gives a more accurate read on how consolidated channels interact.
For long-term impact and budget optimization, marketing mix modeling (MMM) is the right framework. MMM uses regression analysis to decompose revenue into contributions from each channel, accounting for external factors like seasonality and competitive activity. MCP Analytics recommends regression and diminishing-returns modeling specifically to identify optimal spend levels by channel — a critical capability after consolidation, when budget is being reallocated and simple ROAS averages can hide overspending in specific channels.
AtTheRate.ai's consolidation guide emphasizes that normalizing attribution windows and metric definitions across sources is a prerequisite for any of these models to work. If your CRM counts a lead as converted on the date of form fill and your ad platform counts it on the date of click, you will get contradictory numbers from the same campaign.
Data sources to unify
The minimum viable data stack for post-consolidation measurement includes:
- Marketing Strategy: What It Is and How to Create One | Coursera
- Integrating marketing and brand in M&A: The way to superior growth | McKinsey
- Checklist: 12 Metrics for Tool Consolidation | Nex365
- Marketing Data Consolidation: The Complete Guide for 2026 | AtTheRate.ai
- marketing-analytics | MCP Analytics
- Marketing Intelligence / Marketing Analytics | Salesforce
- Inside Reese’s and Oreo’s social-breadcrumb strategy | The Drum
- How Vaseline turned viral beauty hacks into a 43 percent sales surge | Inc.
- Guide to types of marketing strategies, techniques and tactics | AMA
Key integration checks before go-live: deduplication of contact and company records across CRM and ad platforms, normalized UTM naming conventions, consistent conversion event definitions across GA4 and ad platforms, and a single canonical definition of "lead" and "customer" across all systems. Salesforce's marketing analytics platform shows how unified connectors reduce reporting lag from weekly cycles to near-real-time visibility — the kind of speed that makes early warning signals actually useful.
What are the most common pitfalls when evaluating consolidation?
Most consolidation measurement failures are not data problems. They are definition problems and incentive problems. Teams measure what is easy to pull, not what actually answers the question.
Red-flag checklist
Watch for these early warning signs in the first 90 days:
- Sync error rate spikes above 5% in any week
- Active user adoption falls below 60% at the 30-day mark
- CPL increases more than 20% without a corresponding increase in lead quality
- MQL volume drops more than 15% month-over-month without a planned channel reduction
- Branded search volume declines two consecutive months post-consolidation
Pro Tip: Assign a single owner to each red flag metric with a defined SLA — for example, the marketing ops lead must investigate and report on any sync error spike within 48 hours. Without an SLA, red flags get acknowledged in a meeting and forgotten.
When a red flag fires, the remediation path is straightforward: identify whether the issue is a data/technical problem (fix the integration), a process problem (retrain or reassign), or a strategic problem (reconsider the channel or vendor decision). Only the third category warrants rolling back a consolidation element. The first two are operational fixes.
A KPI framework and dashboard playbook you can copy
This framework maps each objective to a KPI, baseline window, sample target, owner, cadence, and the action it triggers. Paste it into your project management tool or BI platform and assign owners before go-live.
| Objective | KPI | Baseline window | Sample target | Owner | Cadence | Action if missed |
|---|---|---|---|---|---|---|
| Revenue growth | Marketing-originated revenue | 90–180 days pre | +15% in 180 days | CMO | Monthly | Audit funnel stages and attribution |
| Cost efficiency | Blended CAC | 90 days pre | -10% in 90 days | Marketing Ops | Monthly | Review channel mix and CPL by source |
| Cost efficiency | TMRR/annualized savings | Pre-consolidation contract total | Hit target within 90 days | Finance + Marketing Ops | Quarterly | Identify uncut redundant licenses |
| Funnel performance | MQL-to-SQL rate | 90 days pre | Hold or +5% in 90 days | Demand Gen Lead | Weekly | Review lead scoring and handoff process |
| Funnel performance | Pipeline velocity | 90 days pre | Hold or improve | Revenue Ops | Monthly | Identify stage where deals are stalling |
| Funnel performance | Sales win rate | 90 days pre | Hold or +3% in 180 days | Sales + Marketing | Monthly | Audit content and sales enablement |
| Brand health | Share of voice | 90 days pre | Hold or +5% in 180 days | Brand/Content Lead | Monthly | Increase content or paid brand activity |
| Brand health | Branded search volume | 90 days pre | Hold or +10% in 180 days | SEO Lead | Monthly | Review brand campaign and PR activity |
| Customer retention | Cohort retention (30/60/90 day) | Last 3 cohorts pre | Hold or improve | CRM/Lifecycle Lead | Monthly | Audit onboarding and nurture sequences |
| Operational health | Active user adoption | 30 days post go-live | 80%+ at 30 days | Marketing Ops | Weekly | Identify non-adopters and retrain |
| Operational health | Sync error rate | — | Below 2% daily | Marketing Ops | Daily | Escalate to integration team within 48h |
| Data quality | Data quality score | Pre-migration audit | high field completeness | Data/Ops Lead | Weekly | Run data hygiene sprint |
How to operationalize this framework
Assign every row to a named owner before the consolidation goes live. Each owner is responsible for pulling their metric on cadence, flagging deviations, and escalating when a target is missed for two consecutive periods. Set a data quality SLA: any metric that cannot be pulled cleanly within 24 hours of its reporting date is a data problem that needs immediate attention, not a footnote.
The executive dashboard should show six metrics: marketing-originated revenue vs. target, MER trend, blended CAC vs. baseline, MQL-to-SQL rate, active user adoption, and SOV. These six give an executive a complete picture of financial performance, funnel health, operational adoption, and brand trajectory in one view. Channel-level troubleshooting dashboards — CPL by source, sync error logs, cohort retention curves — live one level below and are owned by the ops team.
A performance marketing framework that ties campaigns to revenue and builds KPI ownership from the start is what separates teams that can report consolidation ROI confidently from those that are still arguing about definitions six months in.
What does the evidence say about measured consolidation outcomes?
The case for rigorous measurement is not theoretical. McKinsey's research on marketing and brand integration in M&A found that applying structured integration practices correlates with 1.5–2.0x higher revenue synergy capture compared to less structured approaches. The implication is direct: the measurement discipline described in this article is not overhead — it is what makes the synergies real.
"Integrating marketing and brand in M&A requires fact-based brand decisions, not just art. Companies that combine rigorous measurement with brand strategy during integration capture materially higher revenue synergies than those that rely on intuition alone." — McKinsey
Brand-led integrated campaigns show the same pattern at the campaign level. The Reese's and Oreo social-breadcrumb collaboration generated tens of millions of impressions and strong early sales performance precisely because measurement and activation were coordinated across channels from the start. When channels operate in silos, that kind of compounding effect is invisible.
Vaseline's coordinated campaign converting organic beauty hacks into a verified product line produced a 43% sales surge, with rigorous measurement used to quantify the impact across engagement, sentiment, and e-commerce sales. The lesson is not that every brand can replicate those numbers — it is that without the measurement infrastructure, the lift would have been invisible and the investment would not have been repeated.
Omnivancemedia's own client results follow the same logic. An HVAC contractor running fragmented, uncoordinated marketing consolidated into an integrated system and generated $340K in new contracts within 90 days. An e-commerce client moved from $80K to $420K in monthly revenue after consolidating channels, creative, and reporting into a single managed program. Both outcomes were measurable because baselines were set before the work started.
Key Takeaways
Consolidation ROI is provable when you set baselines before go-live, assign an owner to every KPI, and give the measurement enough time to reflect actual deal cycles and brand effects.
| Point | Details |
|---|---|
| Start with six core KPIs | Track marketing-originated revenue, MER, blended CAC, MQL-to-SQL rate, active user adoption, and sync error rate from day one. |
| Baseline before you migrate | Lock 90–180 days of pre-consolidation data and define a counterfactual cohort before any system goes live. |
| Match windows to KPI type | Operational metrics read in 30–90 days; revenue and attribution metrics need 90–180 days and 12 months for full validation. |
| Cap dashboards at 8–12 KPIs | Every metric needs an owner and a defined action; remove any KPI that cannot trigger a decision. |
| Omnivancemedia builds the measurement system | Omnivancemedia sets baselines, builds unified dashboards, and manages consolidated programs that have delivered results like $340K in 90 days for a single client. |
First 90-day priorities:
- Days 1–30: Run parallel tracking, monitor sync error rate daily, and confirm active user adoption is above 60% at the 30-day mark.
- Days 30–60: Pull first MQL-to-SQL and blended CAC reads; compare against baseline and flag deviations to owners.
- Days 60–90: Deliver the first executive dashboard with MER, marketing-originated revenue, and SOV trends; document any attribution drift and correct definitions.
Executive summary template: "In the [X] days since consolidation, marketing-originated revenue [increased/held at] [X%] versus the pre-consolidation baseline, blended CAC [decreased/increased] by [X%], and active user adoption reached [X%]. MQL-to-SQL conversion [held/improved] at [X%], and share of voice [held/increased]. Annualized savings from vendor consolidation are tracking at [$X] against a target of [$X]. The next milestone is [90/180-day] revenue attribution validation."
The measurement gap nobody talks about
The hardest part of measuring consolidation success is not the data. It is the organizational pressure to declare victory before the data is ready.
Revenue synergies from a marketing consolidation typically take two to three quarters to show up in closed revenue, because the pipeline built under the new system has to work through a full sales cycle before it closes. But executives want proof at 30 days. The result is that teams reach for the metrics that move fastest — impressions, MQL volume, platform adoption — and present them as evidence of success before the funnel has had time to validate them.
The discipline is to present leading indicators honestly as leading indicators, not as proof. Active user adoption at 80% after 30 days is a positive signal, not a result. A 10% drop in blended CAC after 60 days is encouraging, not confirmed. The confirmed result is what the 180-day revenue attribution report shows.
The other underappreciated trade-off is between speed and data stability. Moving fast on consolidation reduces the window for parallel tracking, which increases the risk of attribution errors that corrupt your baseline. The teams that get clean measurement results are almost always the ones that ran parallel systems for 30–60 days longer than felt comfortable. That patience is not a delay — it is what makes the ROI case credible when you present it to the board.
Omnivancemedia measures consolidation results so you do not have to guess
Fragmented marketing is expensive in two ways: you overpay for redundant vendors, and you cannot see clearly enough to know what is working. Omnivancemedia solves both at once by combining CRM setup and automation, custom reporting dashboards, and full-channel paid and organic management into a single integrated program.

Clients who consolidate through Omnivancemedia typically see faster reporting cycles, fewer sync errors, cleaner revenue attribution, and a measurable improvement in CAC/CPL within the first 90 days. The HVAC contractor who generated $340K in new contracts and the e-commerce brand that grew from $80K to $420K in monthly revenue both started with a baseline audit and a unified measurement system before any channel work began. That sequence — measure first, then optimize — is what makes the results defensible.
If you are ready to consolidate your marketing and need a team that builds the measurement infrastructure alongside the campaigns, see what Omnivancemedia offers and request a baseline audit.
Useful sources and further reading
These are the primary sources used in this article. Each one is worth reading in full if you are building a consolidation measurement program.
- Marketing Strategy: What It Is and How to Create One | Coursera — Covers why documented, organized marketing plans are the foundation for defensible baselines and measurable outcomes.
- Integrating Marketing and Brand in M&A | McKinsey — The definitive research on how structured integration practices correlate with 1.5–2.0x higher revenue synergy capture.
- Checklist: 12 Metrics for Tool Consolidation | Nex365 — A practical 12-metric checklist with recommended baseline windows and reporting cadence for platform consolidations.
- Marketing Data Consolidation: The Complete Guide | AtTheRate.ai — Detailed guidance on normalizing metric definitions, aligning attribution windows, and building a unified data model.
- Marketing Analytics | MCP Analytics — Explains regression and diminishing-returns modeling for identifying optimal spend levels by channel.
- Marketing Intelligence and Analytics | Salesforce — Shows how unified connectors and dashboards reduce reporting lag and improve cross-channel budget allocation.
- Inside Reese's and Oreo's Social-Breadcrumb Strategy | The Drum — Case study showing how coordinated integrated campaigns generate measurable commercial impact at scale.
- How Vaseline Turned Viral Beauty Hacks into a 43% Sales Surge | Inc — Example of rigorous measurement quantifying sales lift from coordinated, channel-integrated activity.
- Guide to Marketing Strategies, Techniques, and Tactics | AMA — Practical guidance on aligning marketing tactics with business goals and building KPI ownership frameworks.
For hands-on help building and managing your consolidation measurement system, Omnivancemedia's full-service team starts with a baseline audit and builds from there.